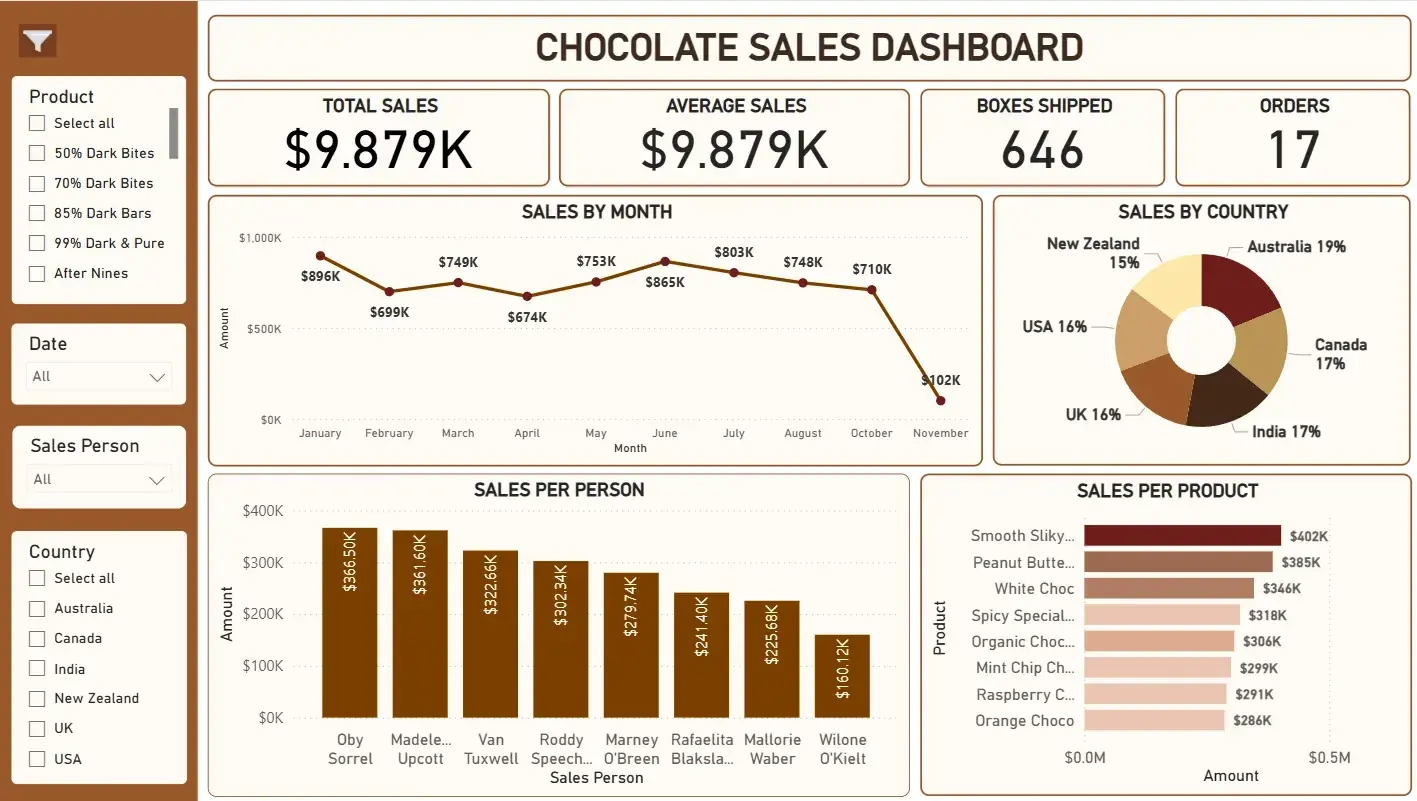
Live and interactive — scroll and click inside. The layout adapts to your screen, just as it does for real visitors.
Overview
An interactive Power BI dashboard analyzing global chocolate sales data, with KPI reporting across regions, products, and salespeople.
The dataset covers more than 1,000 transactions.
Business problem
Sales data can be difficult to interpret without clear reporting and visualization.
Solution approach
A dashboard that presents sales data in a more accessible format to support analysis and decision-making.
Have a business challenge in mind?
Tell us about the workflow, customer experience, or platform you want to improve. The team will review your inquiry and follow up to discuss next steps.